
Nick Ziong, Financial Modeling Manager, TECHIIA International Holding.
I wrote this text a few weeks before the Russian invasion and, for obvious reasons, postponed it until better times. But better times are a relative concept, and the need to earn and pay taxes to create global products is still here and has become even bigger. That’s why I decided to unpack financial modeling instructions for you. I hope that it will be useful for startups and young businesses that keep the economical forefront going.
Let’s start.
The financial model is a document that helps to put the company in order, especially the newly created one. It includes financial and non-financial indicators and determines the stages of business development, investment attraction, payback period, profit margin, etc. If you have made a financial model correctly - you have done half the work to keep the company on the market.
There is a difficulty: the preparation of a financial model can take from a few days to several weeks. "I'd better spend this time developing a product," some startup executives think. But hold on.
A financial model is a tool that will allow you not only to analyze the effectiveness of activities and deviations from the plan but also increase investment attractiveness. For example, in addition to the presentation of a business project, we at TECHIIA Holding always ask startups for their long-term financial model. It tells us how the project plans to develop and what additional funding is required.
With this document, you are more transparent and understandable to investors - and this is a big plus for a young project.
I will help you to make a financial model without unnecessary movements, based on our living experience. Don't try to do everything in one go. Break the process into very small steps. Better a poor horse than no horse at all.
And always remember the basic rule: overestimate costs and underestimate income.
1. Prepare the file
Before calculations, it is necessary to prepare a file. This is the first and easiest step to help you adjust to creating a model.
I recommend creating three tabs in Excel or Google Sheets:
- Calculation - for the entire calculation part.
- Drivers - here I recommend registering all drivers of a business case. This will make it easier for you in the future to make any changes and for the potential investor to navigate the file.
- Summary - it will reveal all the key indicators from the Calculation tab and help you build graphs and demonstrate key financial and non-financial indicators.
Your file will be analyzed by other people, so it is very important to decrypt each digit you specify. This will avoid many unnecessary questions from the investor and will help you remember how exactly you did the calculation.
2. Define the main KPIs
The KPIs you plan to achieve can be anything. For some it is the number of users, for others - the number of applications installed, for some - the number of goods sold.
For example, for startups that develop mobile applications, Monthly Active Users, Install rates, etc. are usually important. You decide the importance of the indicator yourself.
There can be many such goals, but you should not overload the business case and indicate goals that may conflict with each other. For example, the rate of return on investment and the amount of investment. On the one hand, investments in new equipment may increase production, product quality, etc. in the future. However, such investments will reduce profitability. It is better to choose 3-4 key indicators that can characterize the potential of your product.
If you do not know what indicator you need, you should analyze competitors and the market. I recommend traditional sources, such as Statista and Crunchbase. The analysis may take you a few days, but it will help you understand what potential investors are looking at, what value users are looking for, and what new you can deliver to them.
KPIs should eventually be put on the Summary tab.
3. Determine Drivers
Drivers are indicators the change of which affects the results of the financial model. They can be divided into two types:
Reasonable: drivers confirmed by the analysis of third parties - for example, the expected growth rate. It is desirable to indicate the source of such information.
Unreasonable: the assumptions based on your expectations, such as conversion and potential user outflow.
Of course, it is preferable for the financial model to be based on reasonable drivers only. However, in many cases, it will not be possible to do so, as most of the indicators that are useful to you, will not be publicly available. So you can make your assumptions about the approximate value of an indicator.
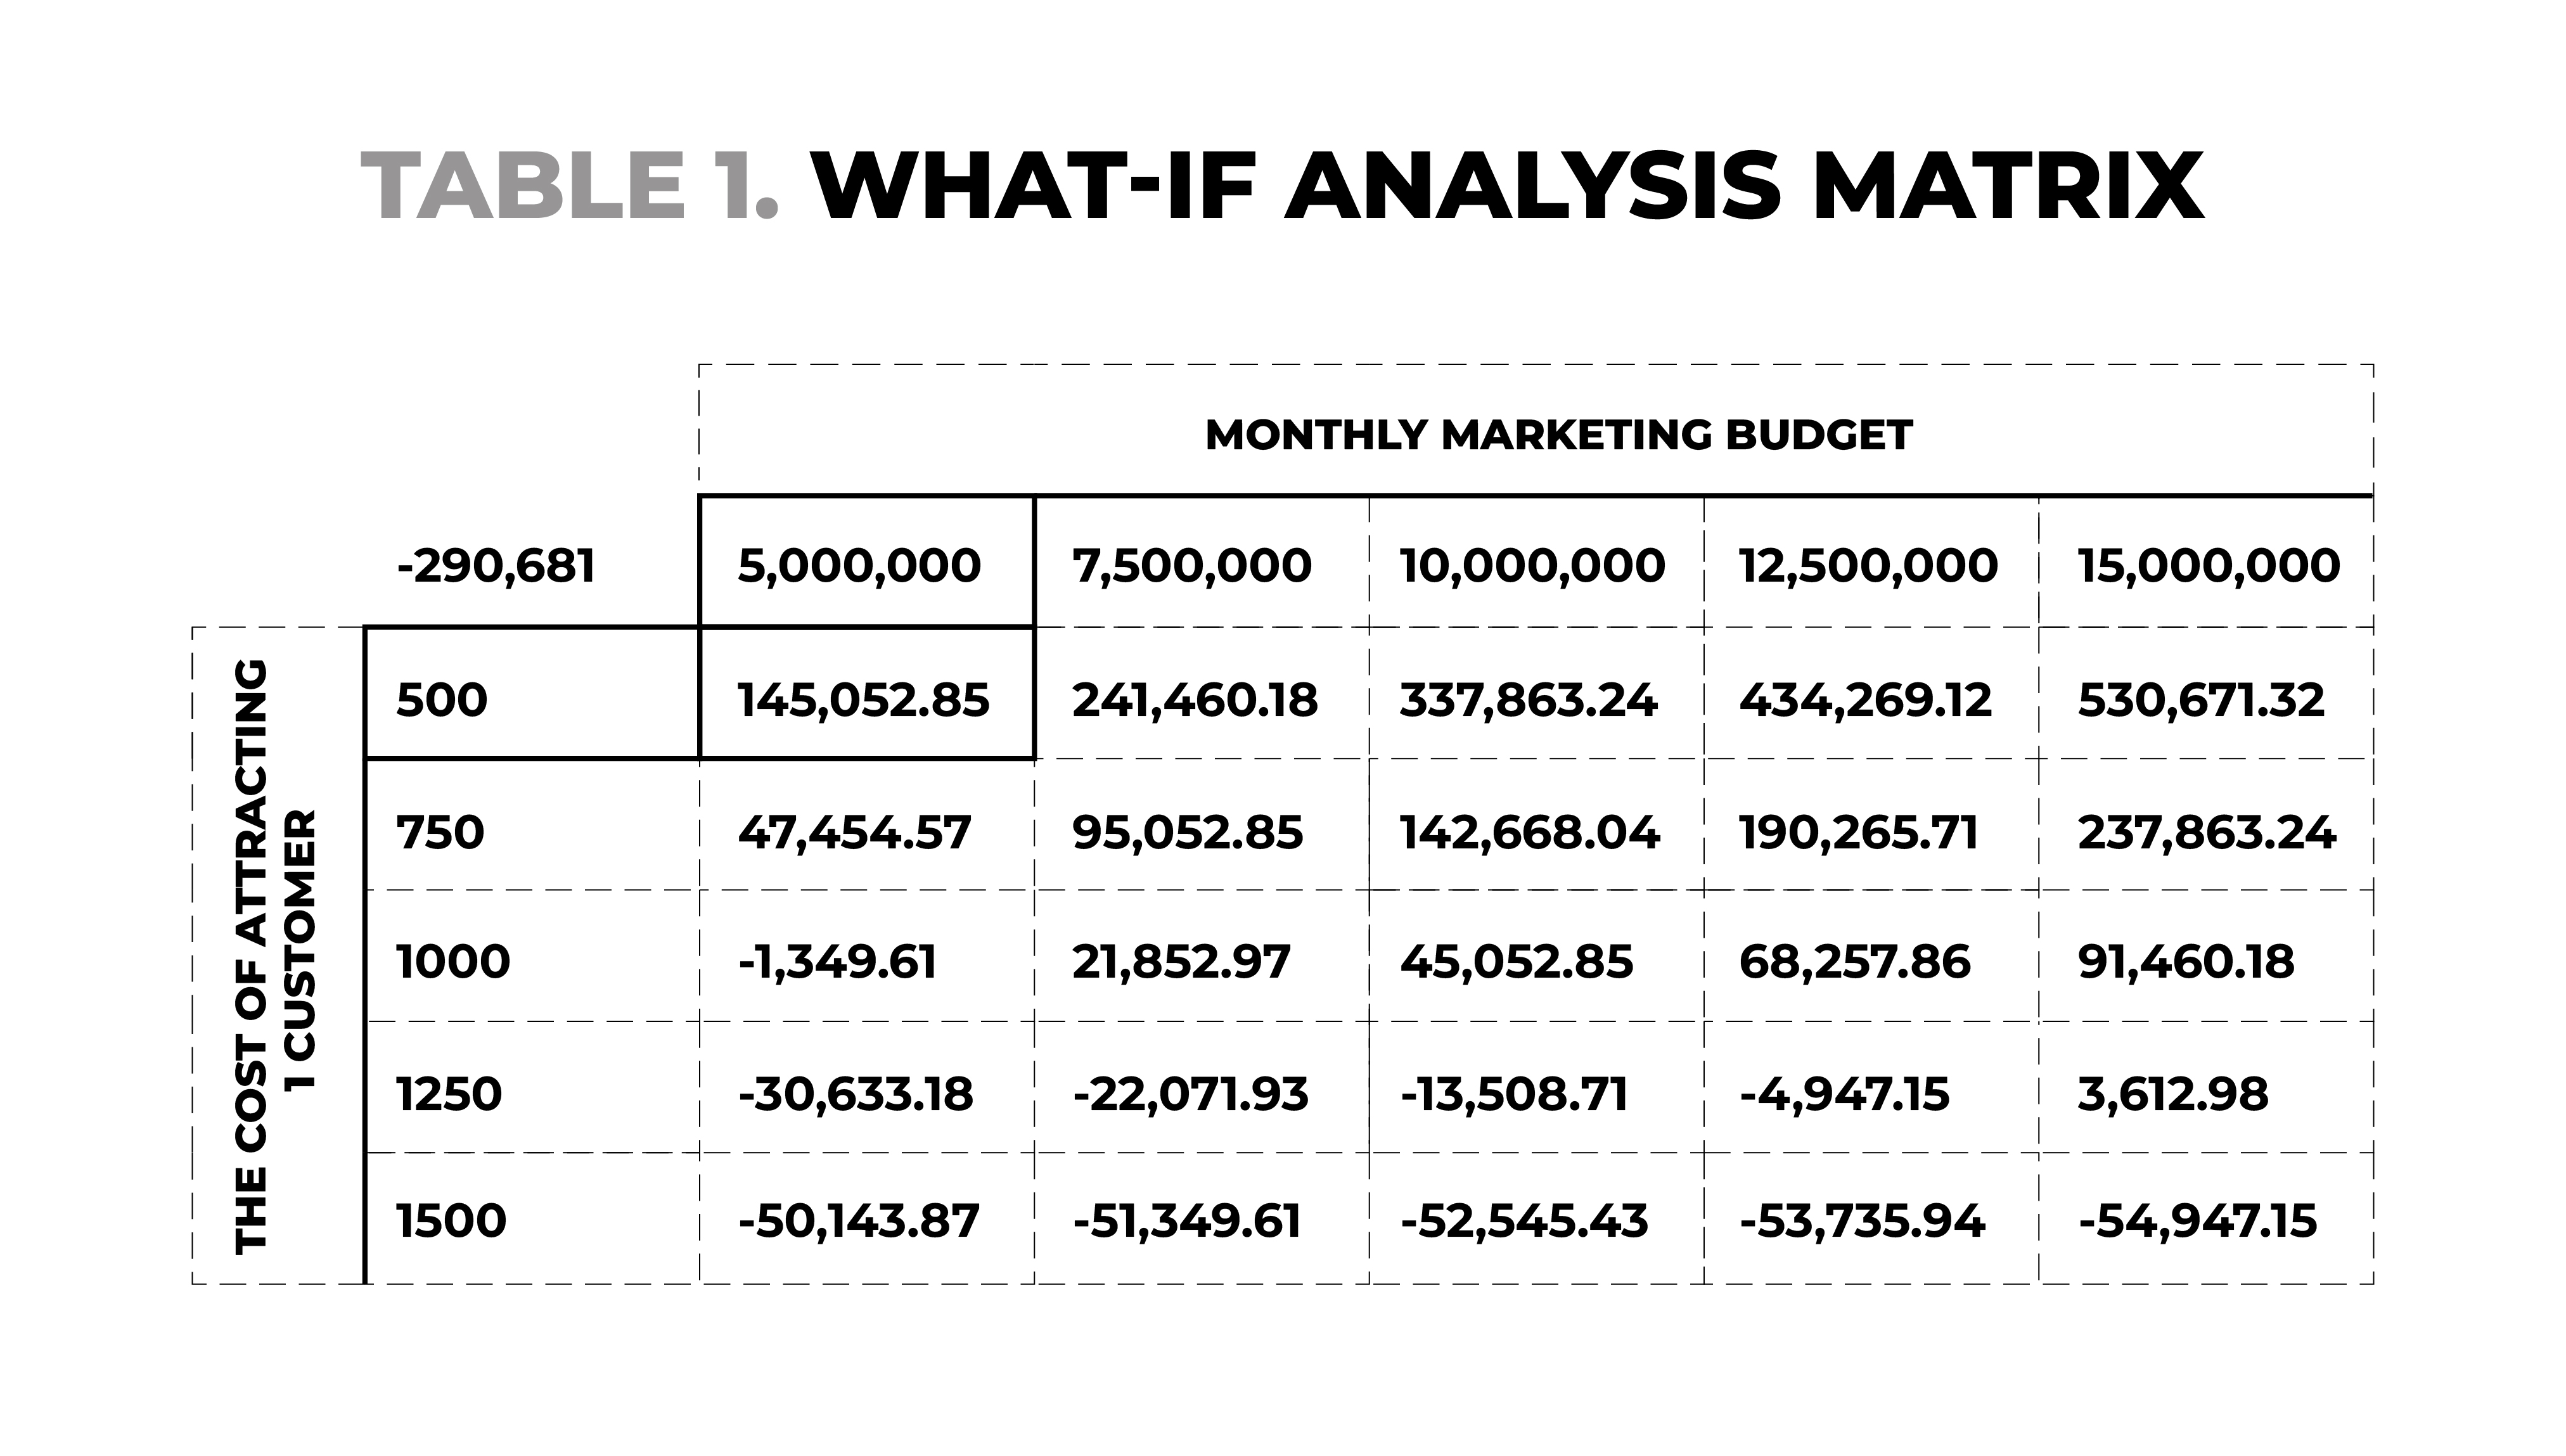
To test the assumptions, I use What-If Analysis, which allows me to understand the impact of the assumptions made on the result.
Here is an example of how the marketing budget size and the cost of attracting one client can affect the financial result of the case. Thus, with a marketing budget of UAH 5 million and the cost of attracting UAH 500 per client, the profit is UAH 145,000. However, if the cost of attracting one client is UAH 1,500, we will receive a loss of UAH 50,000.
Table 1. What-If analysis matrix
4. Calculate Revenue Estimation
When developing a budget, it is important to understand how you will monetize the product/service. One of the most effective ways to calculate income is to multiply the projected base of users/customers/subscribers by the average check of such a person.
For example, in month X, I estimate the number of subscribers to reach 10,000, with my subscription cost of $5 per month. Accordingly, in month X, my revenue will be $5*10,000 = $50,000.
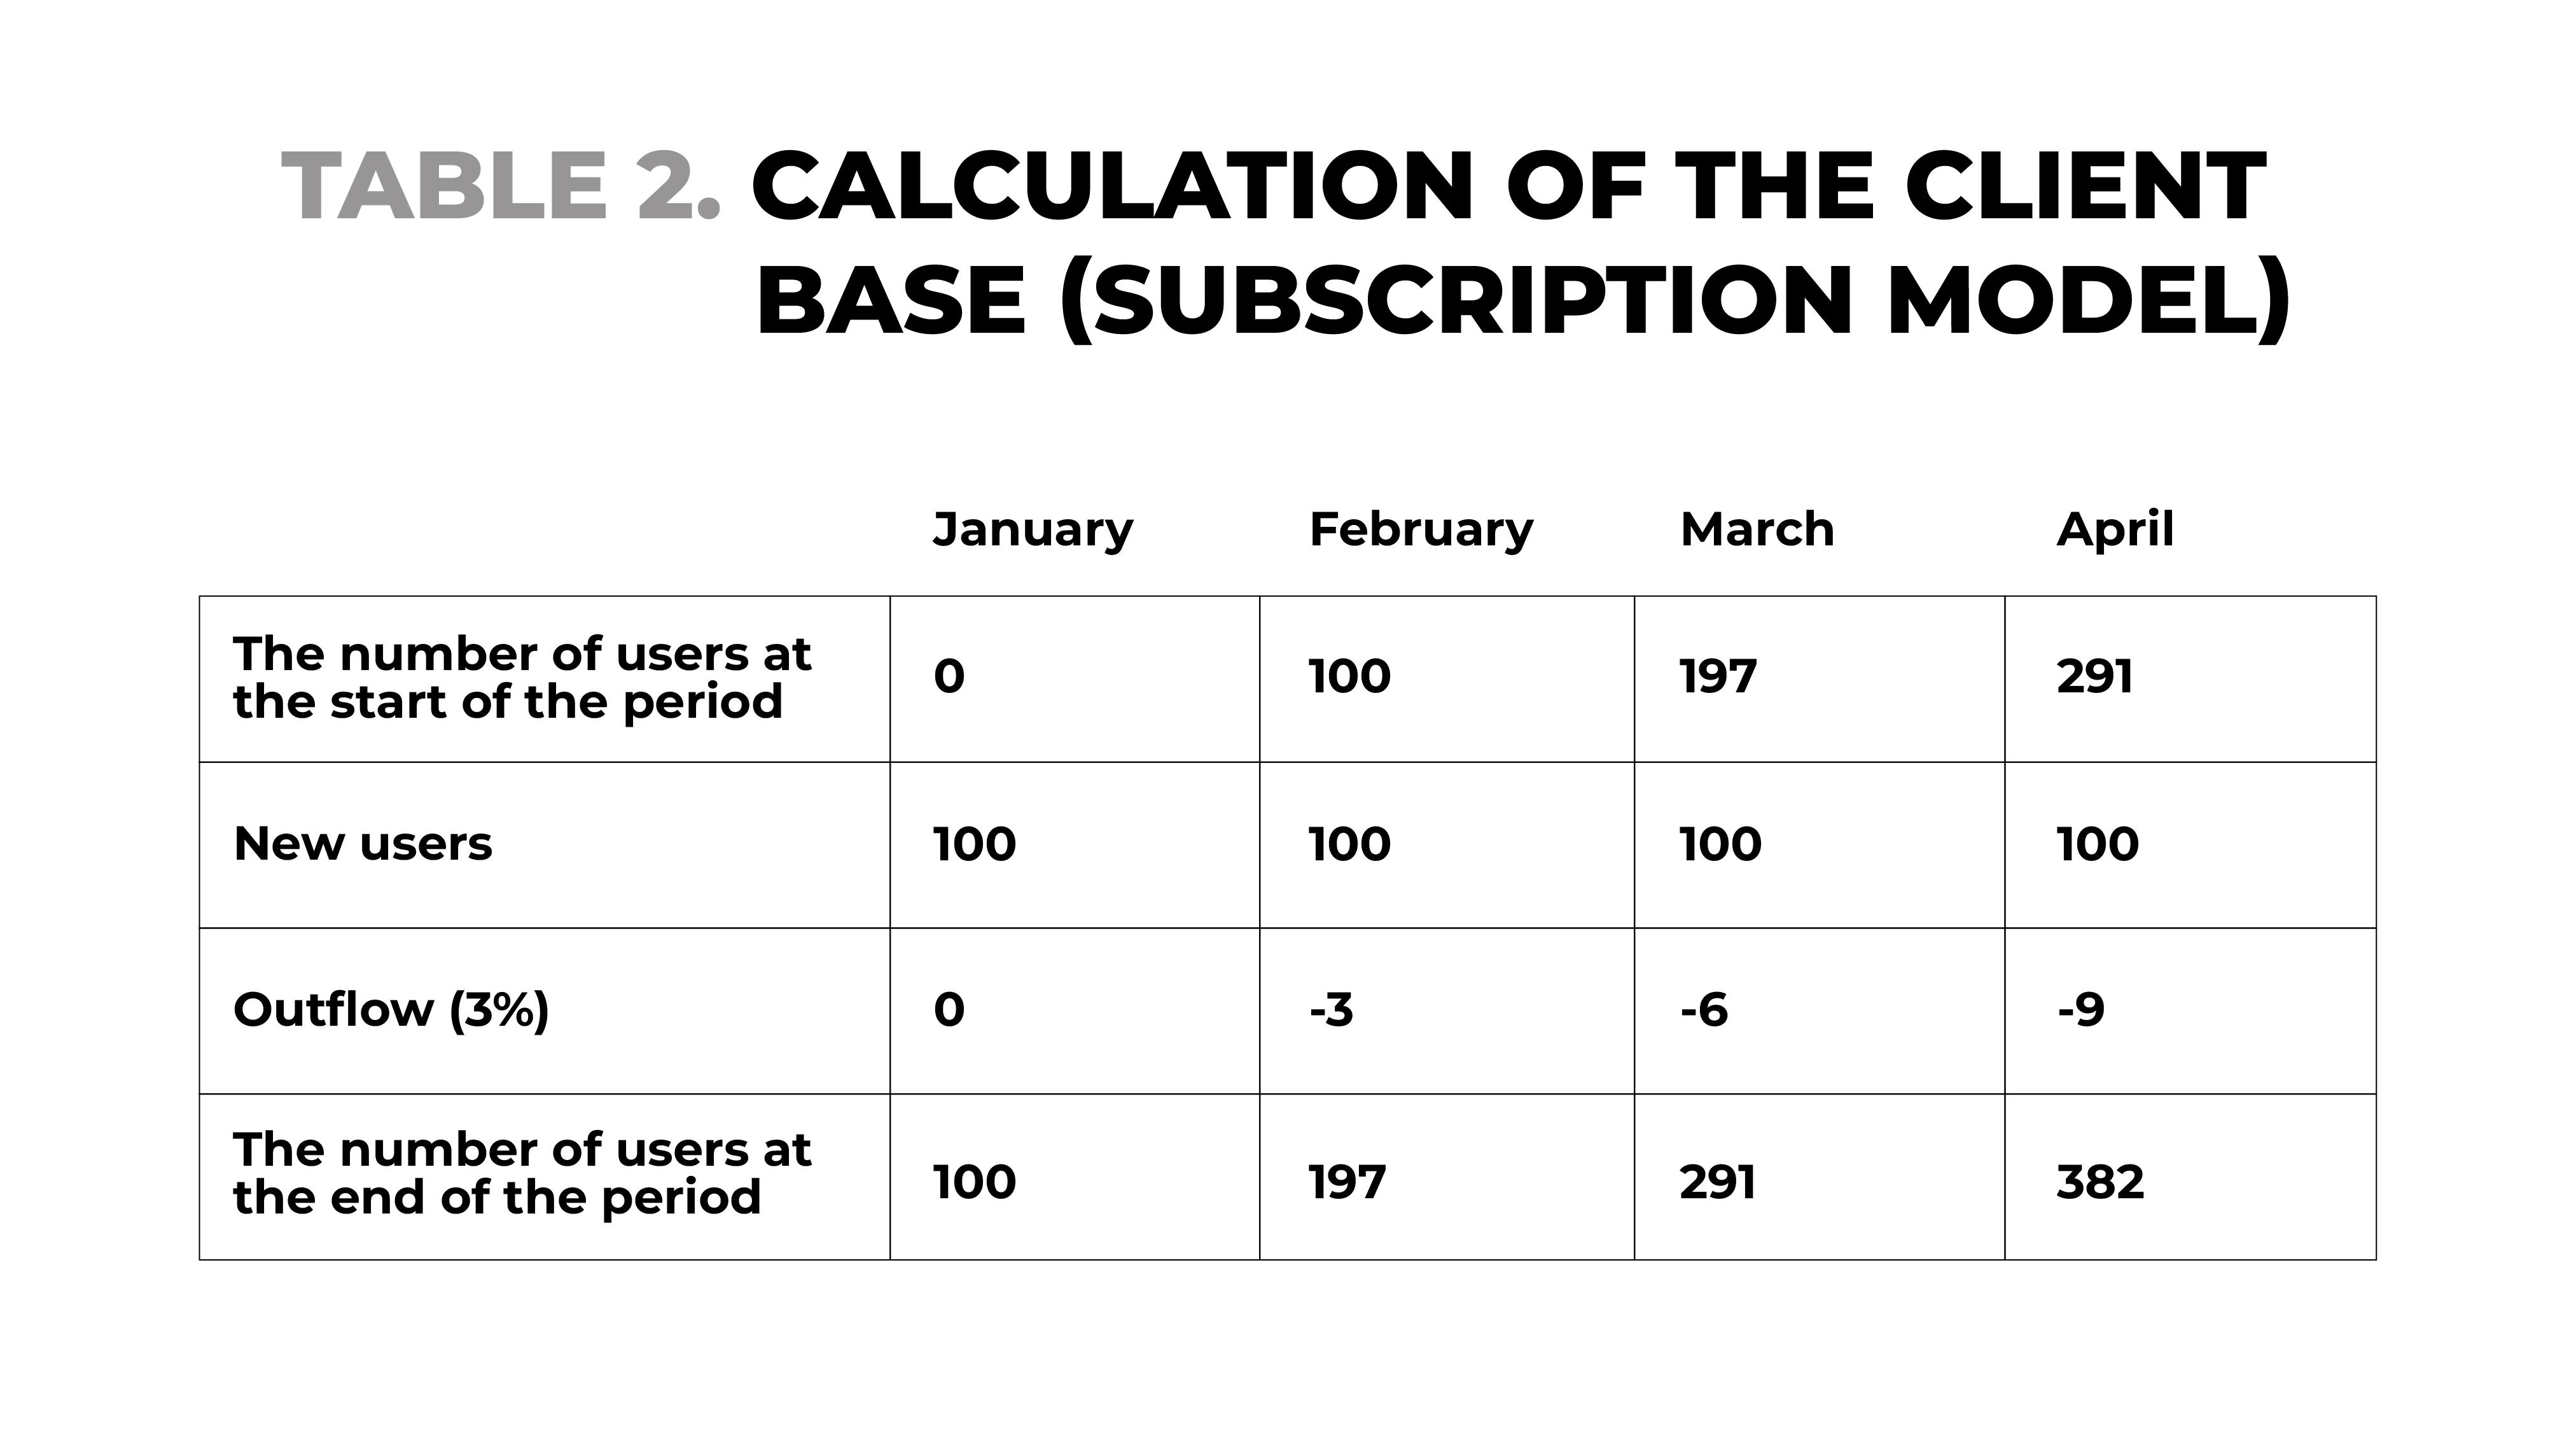
It is crucial in the case of a subscription-based business model to calculate your user base as follows:
The number of users at the start of the period + New users - Users who unsubscribed = The number of users at the end of the period.
Table 2. Calculation of the client base (subscription model)
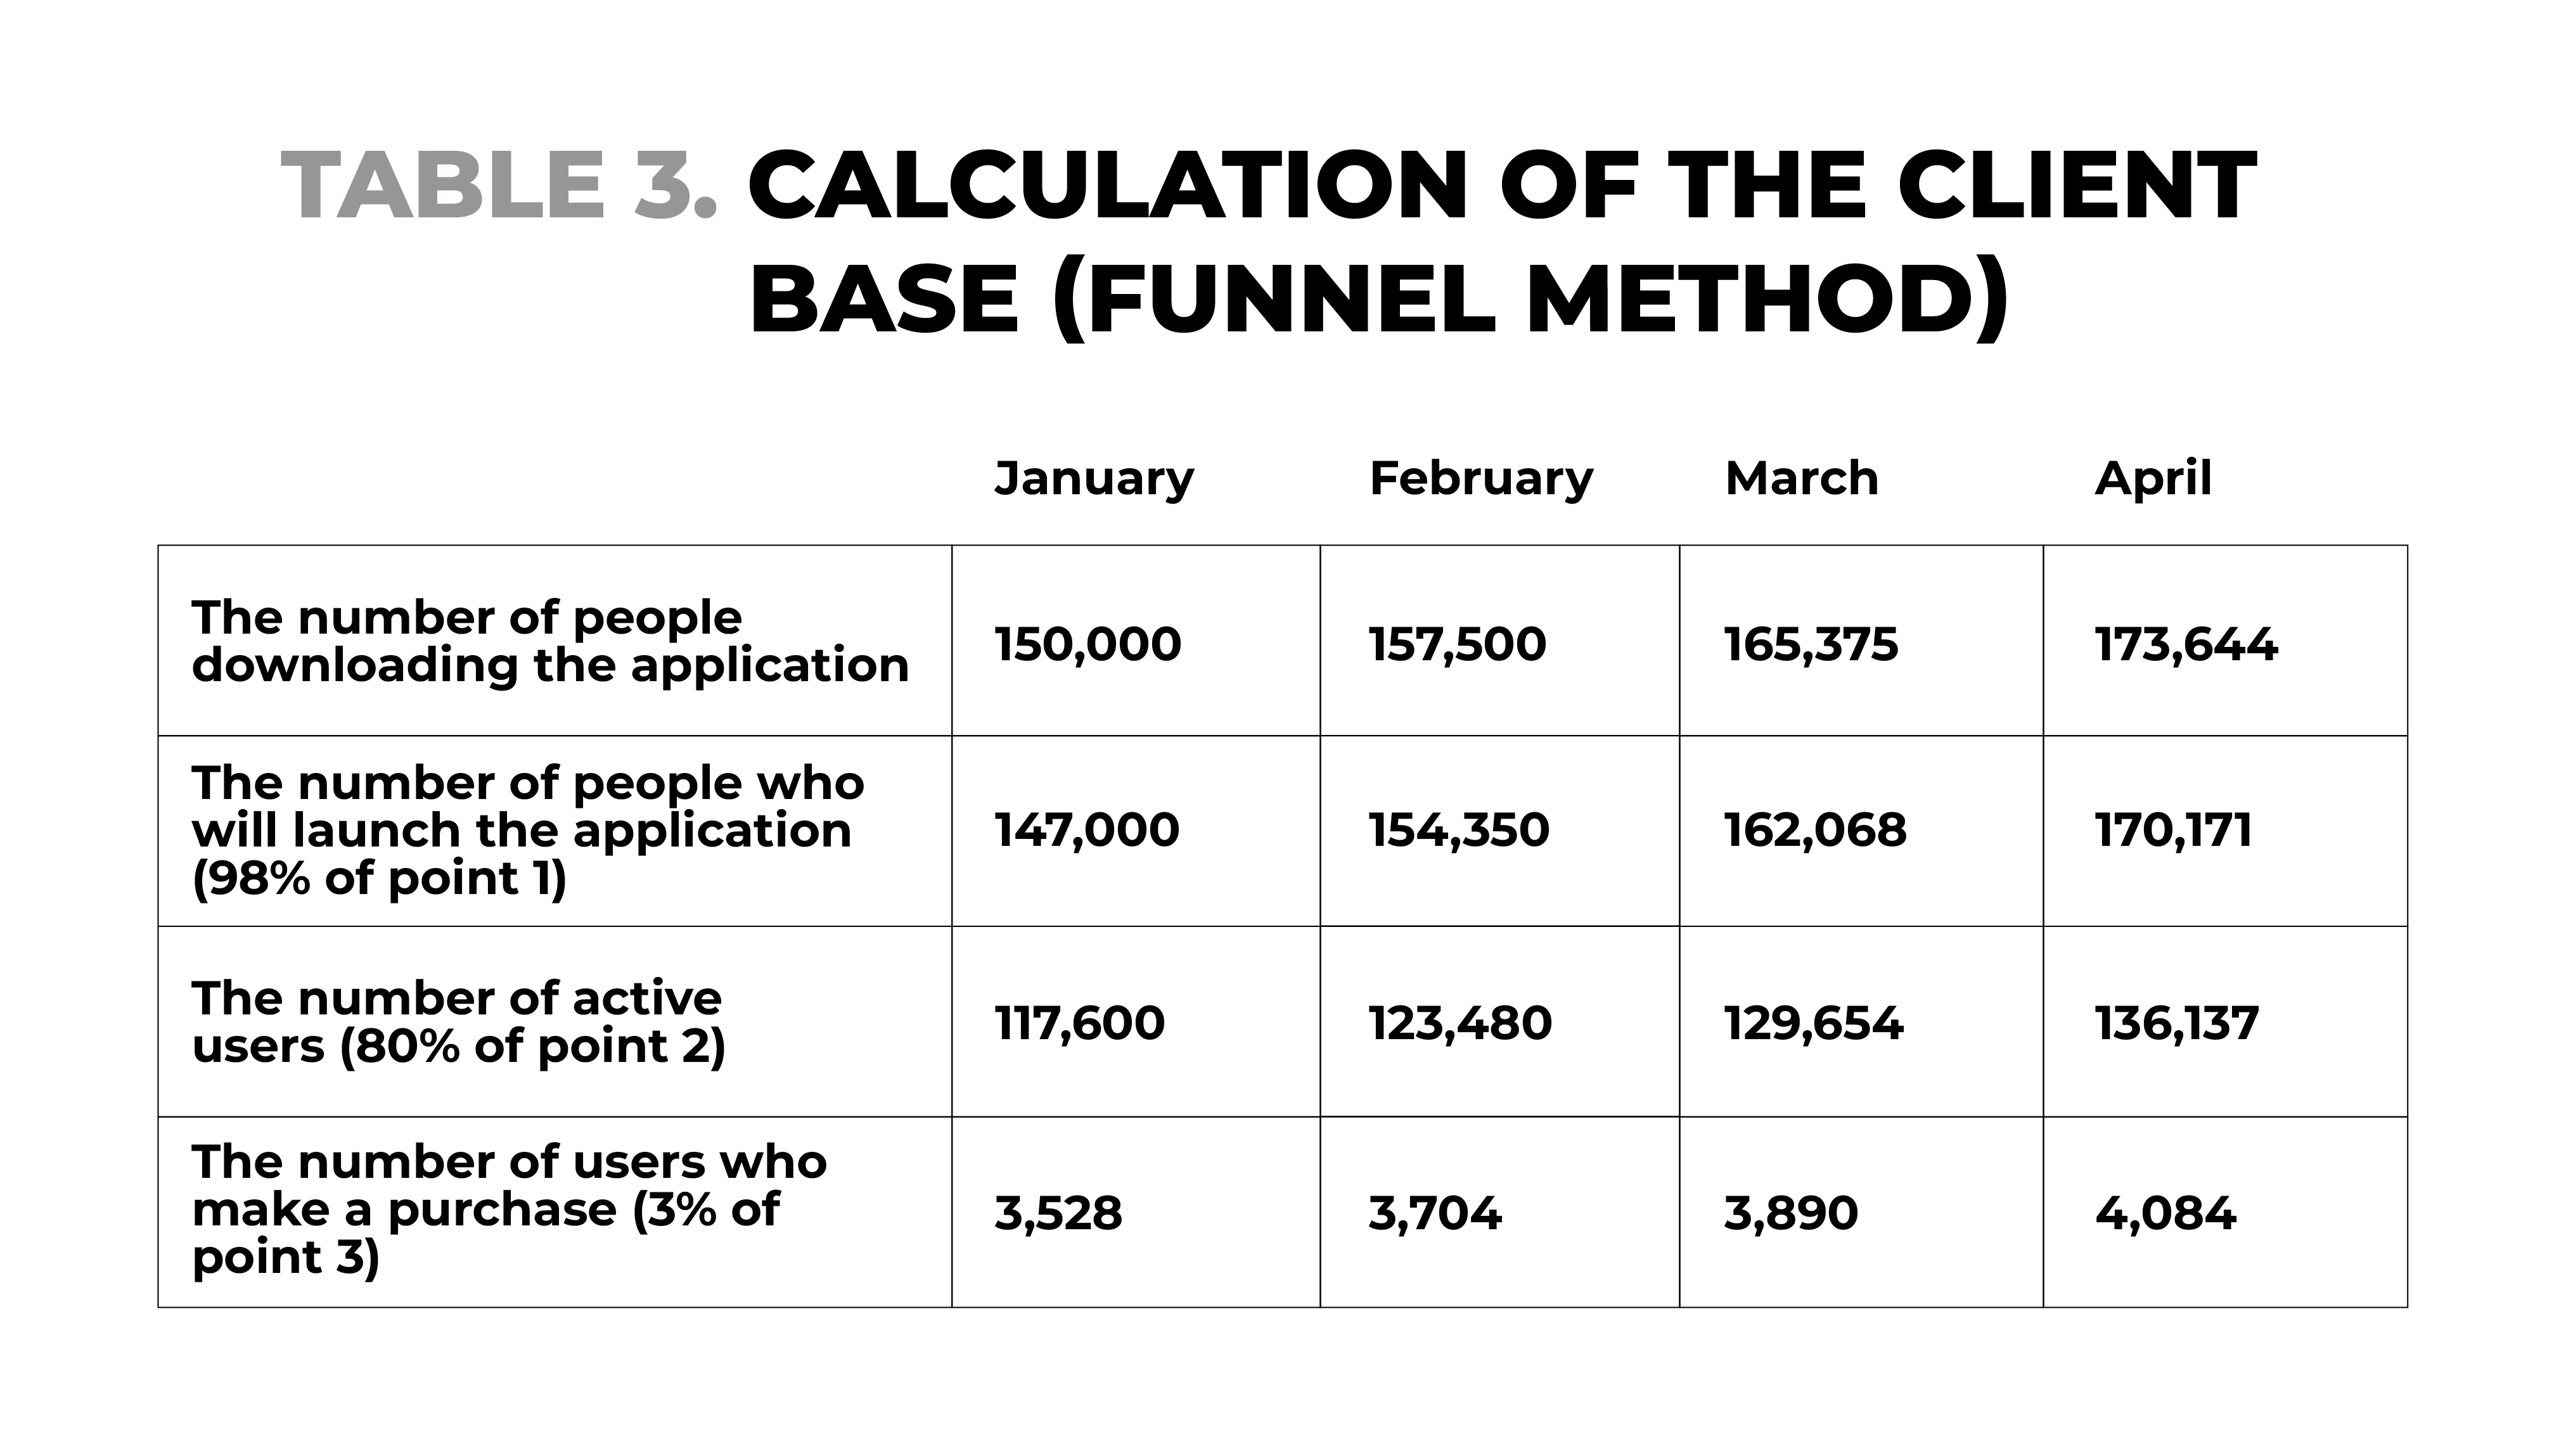
In case you have another model, you can use the funnel method.
Table 3. Calculation of the client base (funnel method)
For a more accurate calculation, you can segment users by certain categories. For example, divide into those who use the service for free and premium users who pay for it.
By the way, free users also generate revenue for startups - in the form of revised advertising or one-off purchases. In some cases, free users generate more revenue than premium ones.
5. Define Cost Estimation
The cost calculation is similar to the revenue forecast. Only instead of revenue per person, the number of units sold should be multiplied by the cost of production and sale of products/services.
Costs include materials, logistics (shipping of materials and/or finished product), labor costs, bank fees, etc. And if, for example, you are developing a SaaS solution, you can include the hosting costs, customer support staff, and apps used for development, as well as the cost of maintaining the IT infrastructure.
Other operating expenses are those not depending on the production volume. These mainly include the following:
- developers' salaries - according to your roadmap;
- administrative staff salaries (financial manager/accountant, recruiter/HR manager, etc.);
- office rental costs (in case you use one);
- travel expenses.
In this case, the same person can perform different functions, if he/she has the proper expertise. You can also add costs with 10-15% on top because it is very easy to go beyond the budget.
Capital expenses (or CAPEX) are also fixed but should be individualized. These costs are not reported in the income statement, but the depreciation of such assets affects operating income before tax. CAPEX includes, for example, the cost of purchasing equipment, land, or buildings.
6. Aggregate data
The last step is to collect and organize all the data in the table. Below you can see typical tables that you can use to summarize on the Summary tab.
Table 4. Financial results form
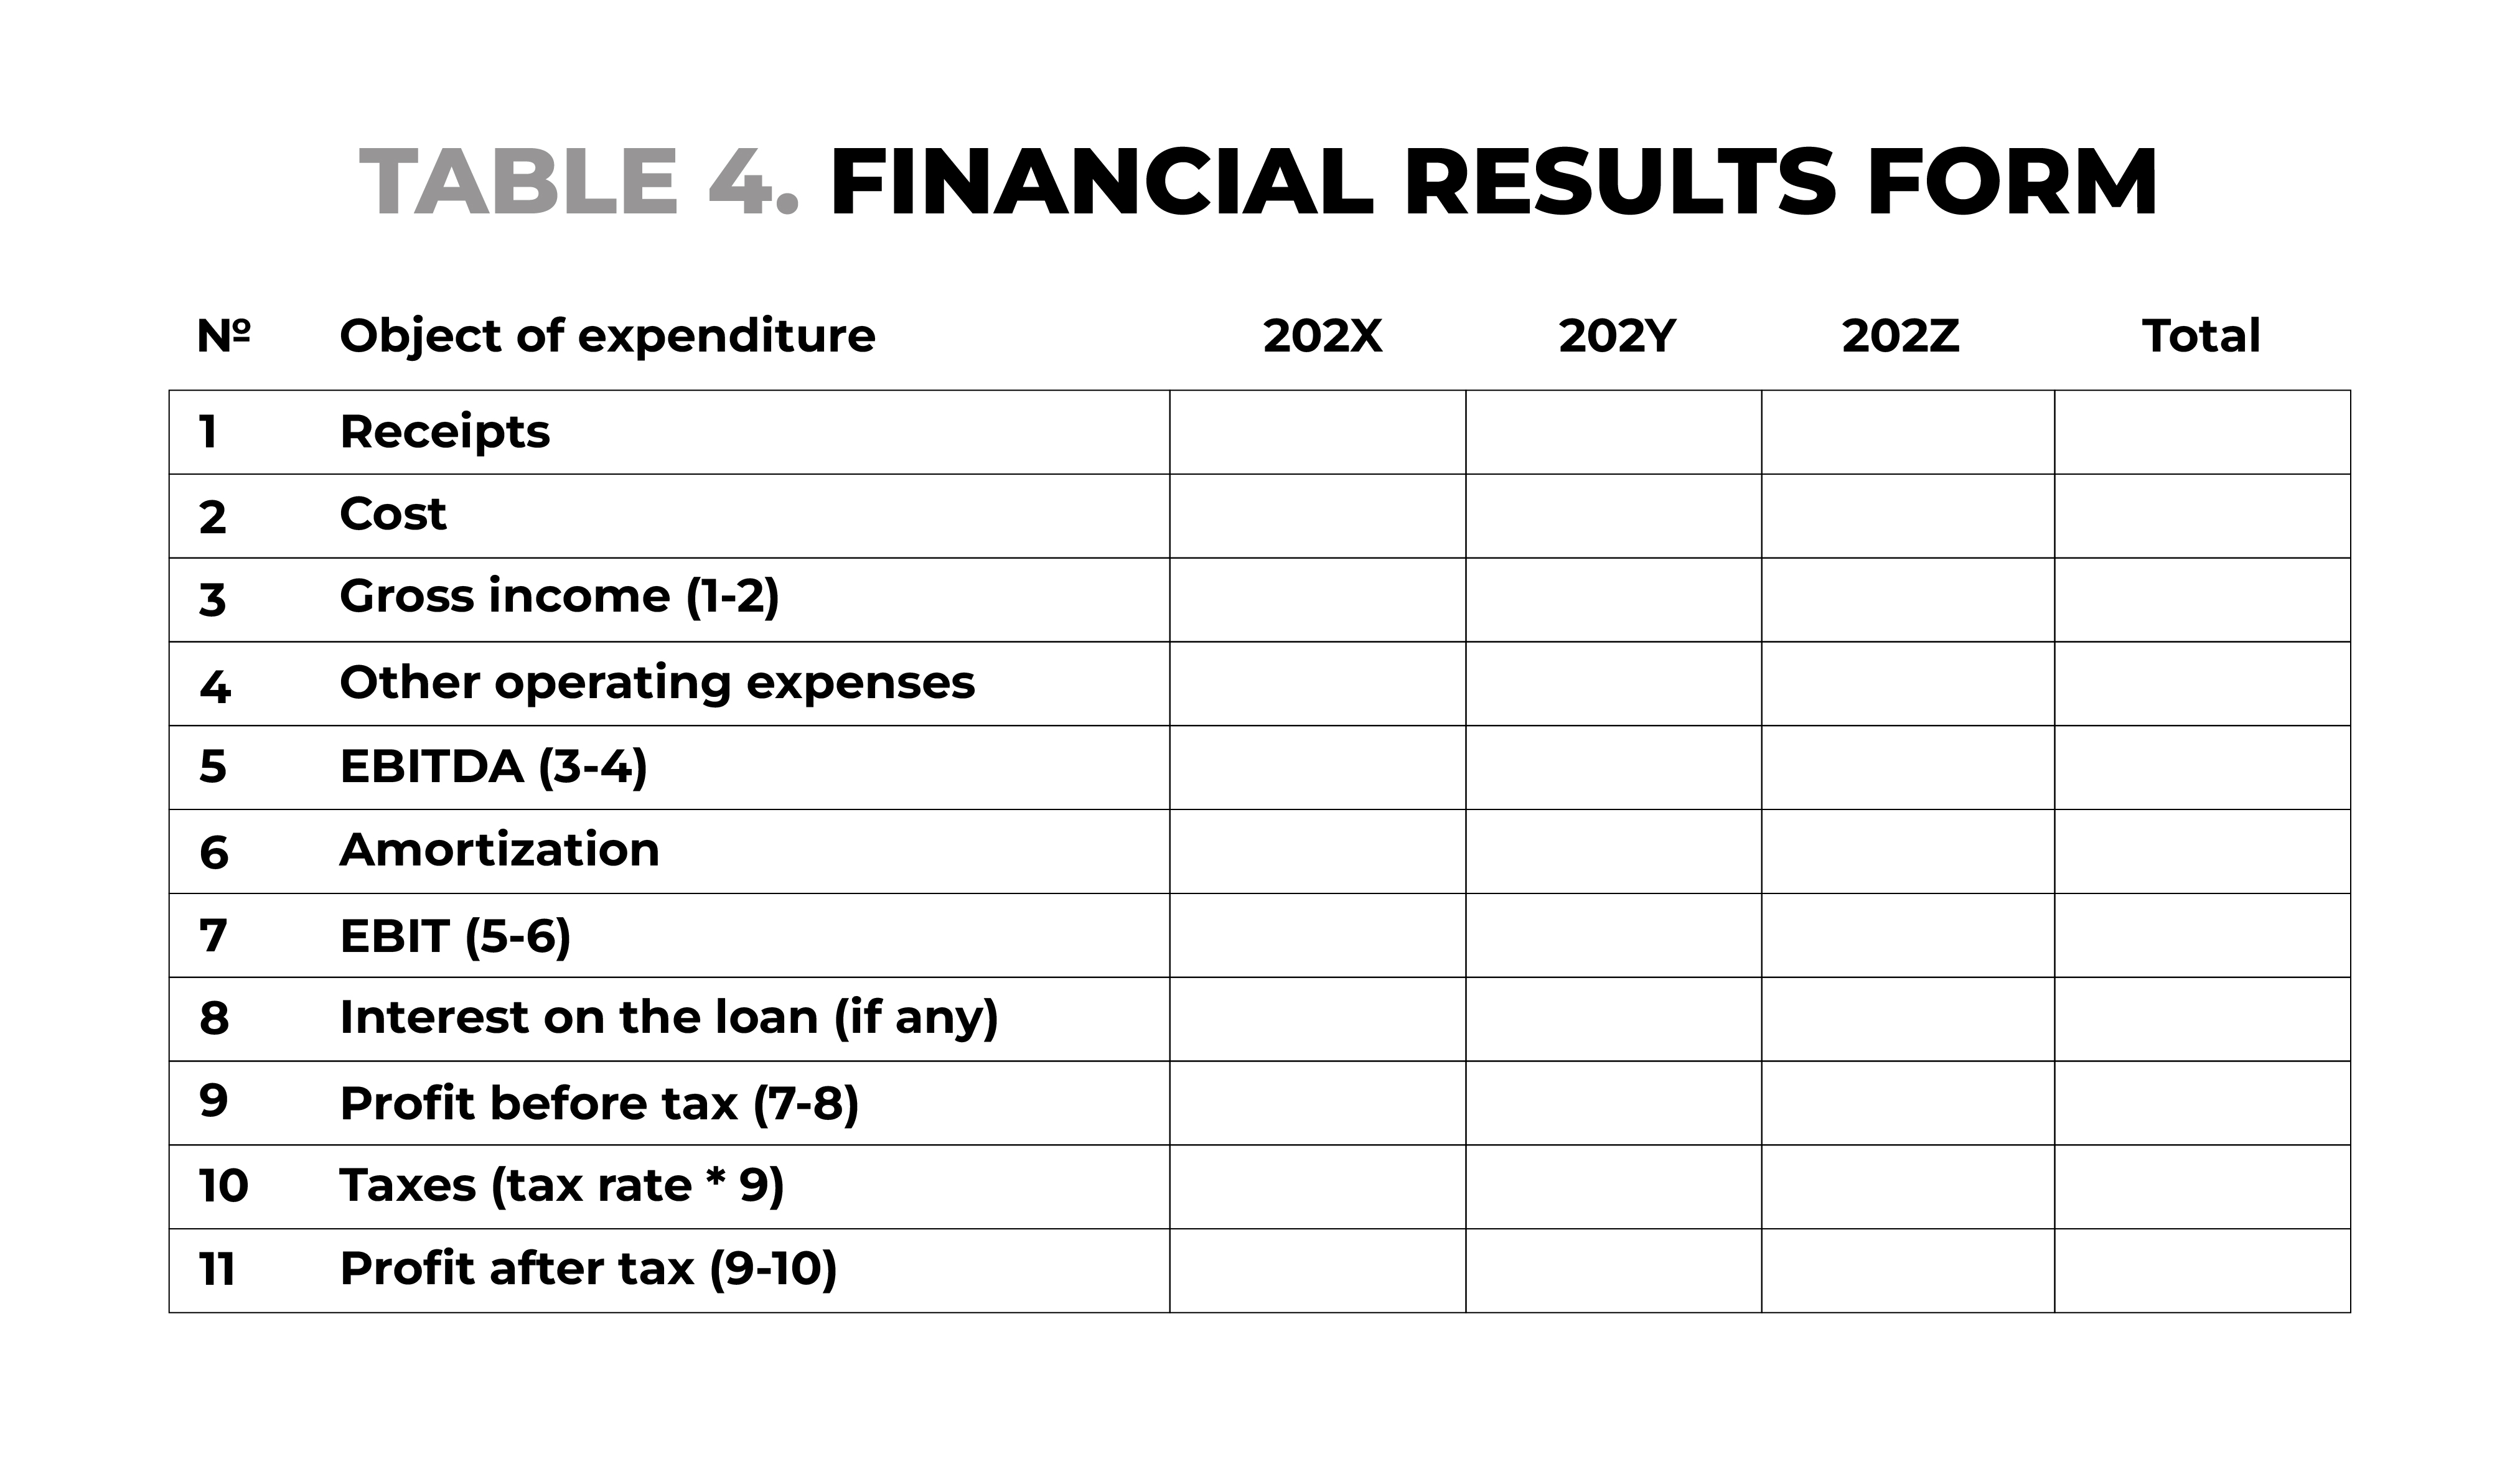
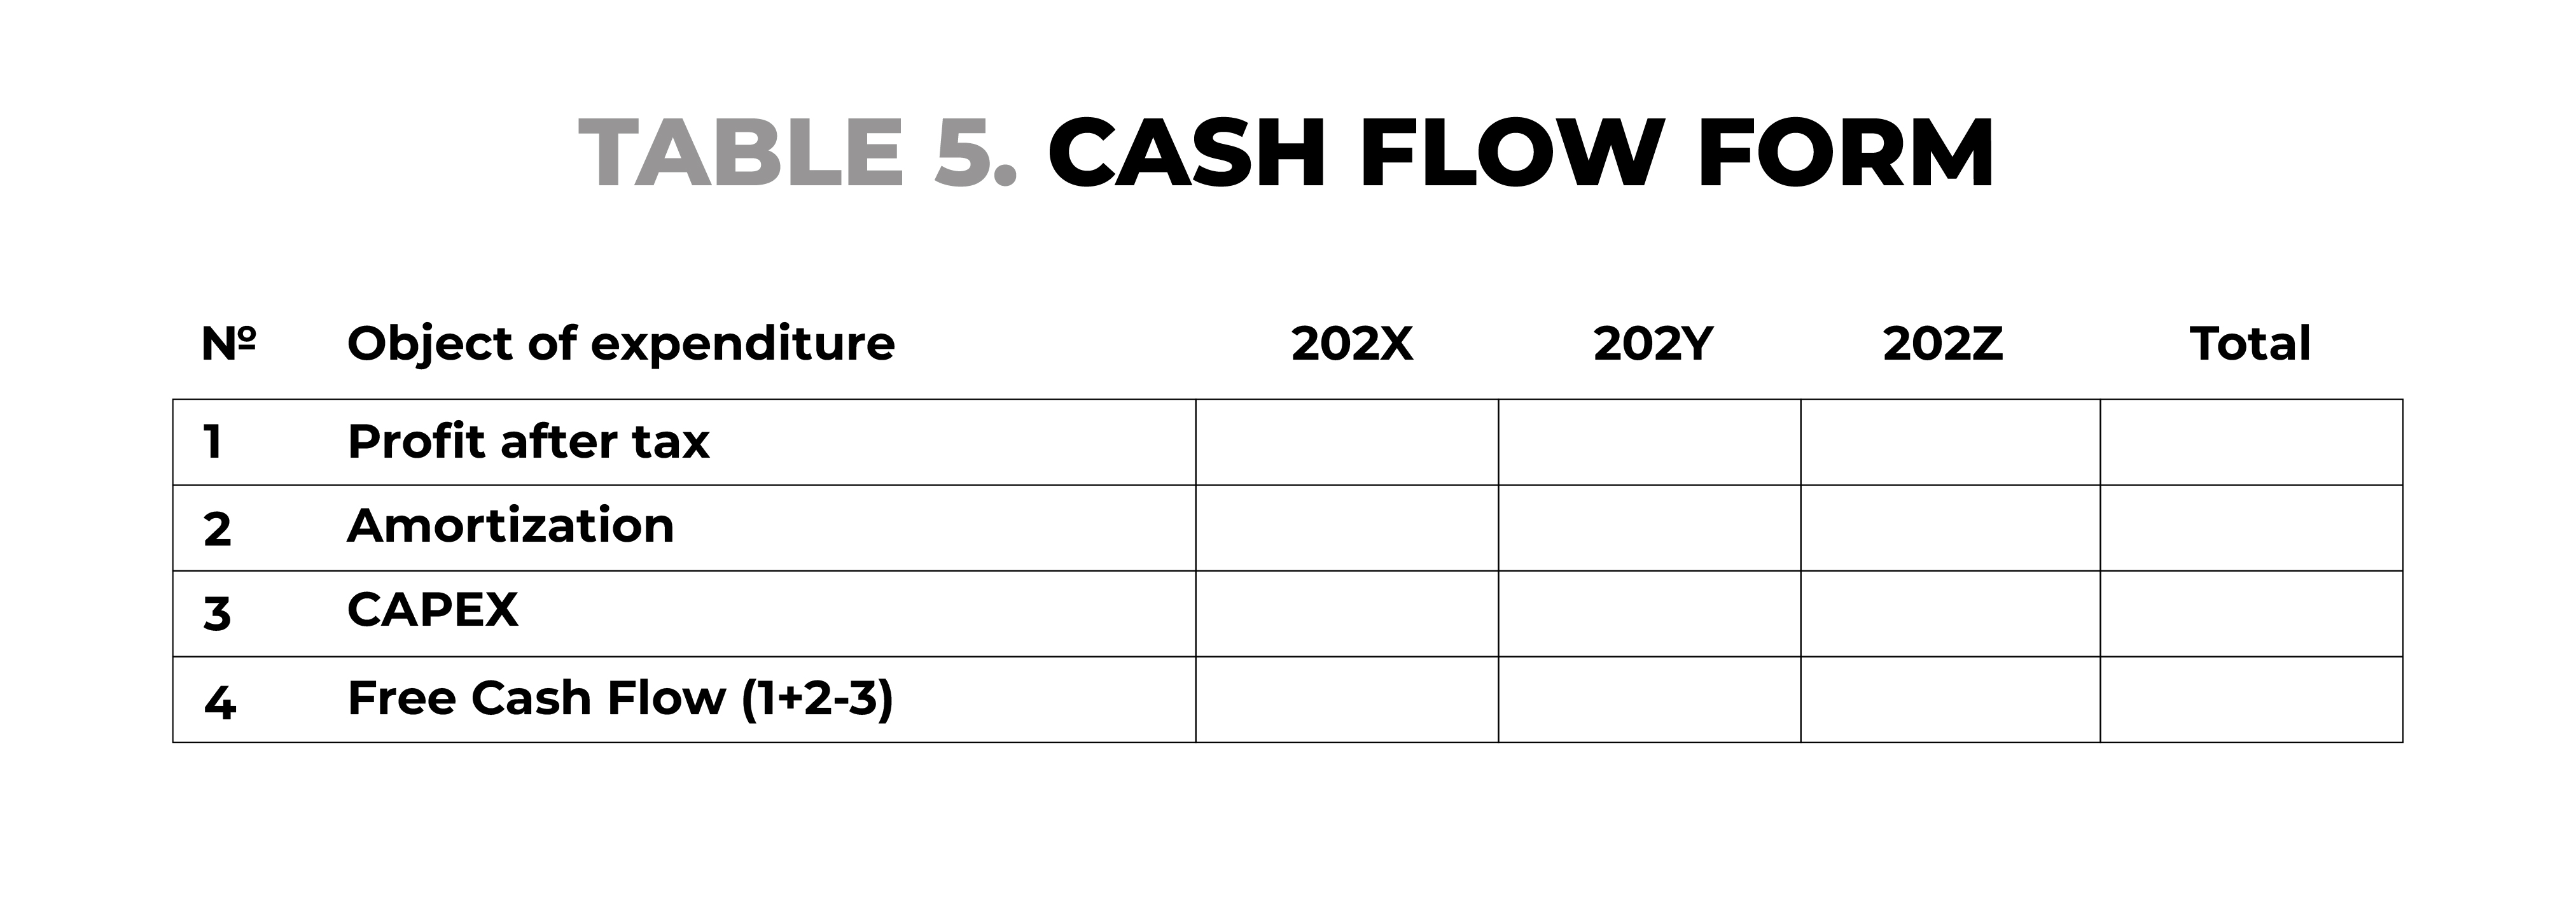
Table 5. Cash flow form
Basically, these are the steps to create a financial model skeleton that every startup needs to build its own "muscles'' on. Unfortunately, because businesses are very different and have different tactical and strategic goals, it is not possible to create a common template. We at TECHIIA go this way over and over again. This path looks long, but it will save you a lot of time and money in the future - especially at the stage of attracting investment.
Original article on .